the United Kingdom
- Argyll and Bute
- Eilean Siar
- East Ayrshire
- South Ayrshire
- Highland
- Strabane
- Dumfries and Galloway
- Stirling
- Anglesey
- Carmarthenshire
- South Lanarkshire
- Shetland Islands
and 56 more on the country page
A seven-day foraging forecast built from weather, woodland and terrain, covering 495 regions. Mushrooms lead — but berries and wild plants have their own seasons, and we track those too. Not a map of other people's finds: a number that changes every day.
Data updated 11 October 2026, 22:33 BST
Start here
What we forecast — and, since you have probably not heard of us, how we test it and what it stands on.

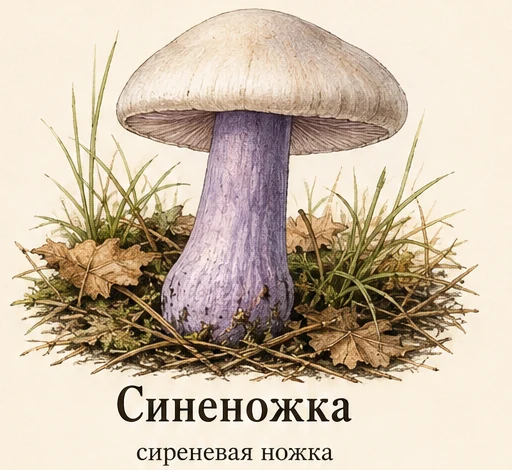
Each species modelled on its own: a penny bun, a chanterelle and a saffron milkcap want different weather and different trees.
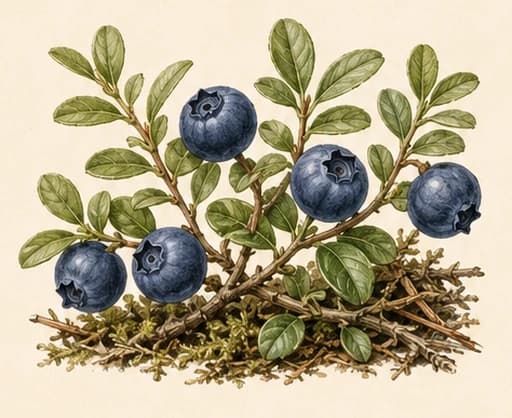
Ripeness and yield are different questions. A May frost strips the blossom, and a bush that flowered well still gives nothing.
Which countries the map covers, and where the numbers are thinner than we would like.
We test the forecast against finds we did not collect, and publish the number that falls short of our own threshold.
Every source named, licensed and dated — including the layers we have not collected yet, which say so rather than leaving a blank.
The ones we are asked most, including the ones whose honest answer is that we do not know.
The field is interpolated from a network of sample points — the same way meteorologists draw a rainfall map from a network of stations.
forecast computed for 495 regions of 495
Every region and county has its own page with a week's forecast and the towns inside it. Hover to stop the ribbon.
the United Kingdom
and 56 more on the country page
Switzerland
and 14 more on the country page
Ukraine
and 13 more on the country page
Serbia
and 13 more on the country page
Montenegro
and 9 more on the country page
Sweden
and 9 more on the country page
Italy
and 8 more on the country page
Croatia
and 8 more on the country page
Norway
and 7 more on the country page
Finland
and 6 more on the country page
Germany
and 4 more on the country page
Spain
and 4 more on the country page
Poland
and 4 more on the country page
Estonia
and 3 more on the country page
Greece
and 2 more on the country page
Czechia
and 2 more on the country page
Romania
and 1 more on the country page
France
and 1 more on the country page
Albania
the Netherlands
Slovenia
Lithuania
Austria
Ireland
Slovakia
Hungary
Bulgaria
Portugal
Denmark
Latvia
Belgium
Luxembourg
Moldova
North Macedonia
Bosnia and Herzegovina
San Marino
My spots
The forecast is computed on a grid of sample points. You do not walk a grid point — you walk your own wood, and finding it again is harder than it sounds: five kilometres off is a different forecast.
This list lives in this browser and never reaches our servers. It will not follow you to another device, and clearing your history erases it.
Why you can trust the number
Not intuition, and not a digest of other people's reports. Everything that feeds the index is named, licensed and checkable.
2.5 km
map resolution
Two woods in the same county are not the same wood, and the map shows it. Not an average over a region — a particular place.
Weeks
not «it rained yesterday»
Fruiting does not follow the rain by a day; it follows by one to two weeks, and the lag differs by species. The model carries a month of weather and knows each lag.
Per species
each one modelled separately
A penny bun, a chanterelle and a saffron milkcap want different weather and different trees. A single «mushroom index» for all of them is an answer for nobody.
Backtested
against finds we did not collect
We test the forecast against independent field records and publish the result — including where it falls short of our own threshold. Nobody else in this field does that.
Behind the index are the same numerical weather models national forecasters run, 10-metre satellite land cover, and a separate model for each species. Every source, licence and collection date is listed in full on the data page.
How it works
The index is not folklore. Three sources are computed together and refreshed every six hours.
The model does not read yesterday's shower; it reads the last month, and it knows how many days after rain each species appears. Soil moisture at 7–28 cm matters more than rainfall — mycelium responds to what reached it a fortnight ago.
Woodland, conifer share, elevation, slope and protected areas are computed per map cell. The same rain in a hollow and on a south slope gives a different result — an average over a region cannot know that.
Quiet → Starting → Building → Peak → Fading. You see not only how much today, but where the week is going: go now or wait three days are different answers, and the number alone gives neither.
Plainly
A forecast model gets things wrong. We would rather say so here than lose your trust once.
Questions
We cannot answer that yet, and we would rather say so than guess. Foraging rights in Europe differ not just by country but by landowner and by protected status: Italy issues permits region by region, England depends on whether the land is access land and on the owner's permission, and nature reserves have their own rules almost everywhere. A legality layer is the next thing we are building. Until it exists, check the rules for the specific place you are going.
No, and the difference matters. A map of finds answers «where», from other people's pins. We answer «when»: the forecast is built from weather, season and the history of the flush, and it changes every day. We have no crowd-sourced map of spots, and we do not pretend otherwise.
For some regions we do not yet have live weather, and the forecast runs on climate normals instead. Where that is the case the page shows a «demo data» badge beside the number. It reflects the real state of the service, not decoration, and it disappears by itself once the region moves to live weather.
The scheduler recomputes every six hours from the past week's weather, and pages refresh with it — at least hourly.
The index reads weather and season — things that are the same for tens of kilometres around. It does not know your particular wood, and that is where the mushroom grows. The usual reasons: wrong trees — every species has its own, and no weather makes up for the wrong stand; the wood was felled recently or is young — the mycelium takes years to recover; the spot is picked out — everything near a road or a car park goes over a weekend; the flush has been taken — you came a day after those who came on time; or the flush passed and slugs and larvae got there first, which the model cannot see. The reverse holds too: a low index does not mean an empty wood. It means the conditions are against you, not that there is nothing there.
We publish the answer rather than claim one. Tested against independent field records, the model ranks the day of a real find above a random day in the same place about 61% of the time, where 50% would be a coin toss. That is better than chance and short of the threshold we set ourselves beforehand. The full figures, including the ones that flatter us least, are on the «how we check» page.
No. Nothing on this site tells you that anything is edible. We show where and when species are likely to be fruiting, and we name dangerous lookalikes — but identification in the field is yours, and where you are unsure the answer is to leave it.