
Cowberry
Vaccinium vitis-idaea
Dry pine woods, lichen heath, sandy ridges and the drier ground between bogs. It does not grow with wet feet, and that is the first thing separating it from cranberry.
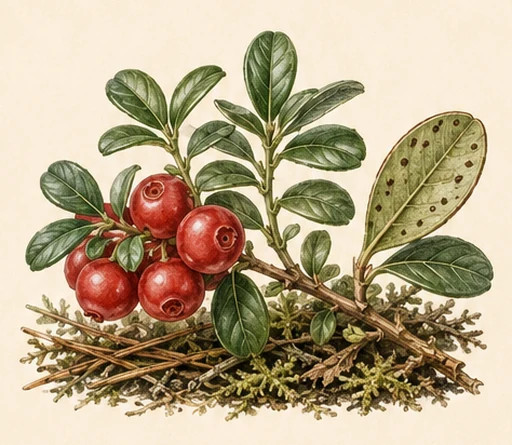
The leaves stay green through winter, so the plant can be found in any month. Fruit picked after the first frosts is sweeter and softer, and it travels badly. It is sold in shops as lingonberry.
Where people are picking now
the best place in the region — not an average over the region. Regions are ranked by today's number.
The fraction beside the stage says how many measurement points out of how many the region was computed from. “1/22” means the weather history was long enough at one place out of twenty-two: the number describes that place, not the whole region.
- Friuli-Venezia Giuliaripe100
- Trentino-Alto Adigeripe100
- Venetoripe100
- Abruzzoripening99
- Valle d'Aostaripening99
- Emilia-Romagnaripening96
- Liguriaripe92
- Ticinoripe76
- Toscanadropping69
- Piemonteripening2/4945
- Apuliadropping0
- Basilicatadropping0
The forecast is computed for 23 regions out of 583. The rest are not listed — that is "not computed", not "no berries".
Map
The field is built from a network of measurement points, the way a meteorologist draws a rainfall map from a network of stations: the value is computed at each point and interpolated between them. A cell is about 250 km² across, which is the resolution our weather data comes at, and we do not draw it finer: that would be invented precision. Only the “how much” goes into the colour, not the stage: “a little, ripe” and “plenty, still green” look the same on the map — read the stage on the card. Blank cells are where the season history was too short to compute, not where the berry is absent.
All berries, compared for today
Your comment
No sign-up. A question, a correction, an observation — all welcome.